Context
We founded a market-making firm, which meant everything had to be built from the ground up: the engine, the trading algorithms and the infrastructure around them. As co-founder and CTO I designed and wrote the whole system, and it now runs across more than thirty clients in production.
The platform is large. The diagram below shows the whole system and the people who operate it; this case study zooms in on the observability stack, the metrics database and Grafana highlighted below. The core engine and the AI copilot have their own case studies.
The problem
A market-making desk runs 24/7 with capital permanently at risk across many venues and clients. Without real-time visibility, the team is flying blind.
- You cannot tell, at a glance, whether a strategy is healthy: is the spread on target, is the inventory balanced, are quotes fresh?
- Problems are expensive and time-sensitive: a stale feed, a spread drifting out of band or a service going quiet can cost money within minutes.
- The same questions repeat across more than thirty clients, each on different venues, symbols and accounts.
- Raw logs scattered across services are useless for spotting any of this in time.
Objectives
- Real-time visibility into every client, venue, symbol and account.
- Track the metrics that actually matter for market making: spread, order-book depth, inventory, open orders and own liquidity, fills and PnL.
- Detect anomalies and page the team before they turn into losses.
- One coherent pipeline, from the services to storage to dashboards and alerts.
My approach
Every Fortuna service emits structured metrics; a pipeline ships them into a time-series database; Grafana sits on top for dashboards and alerting. The result is a single source of truth the whole desk watches.
The technical solution
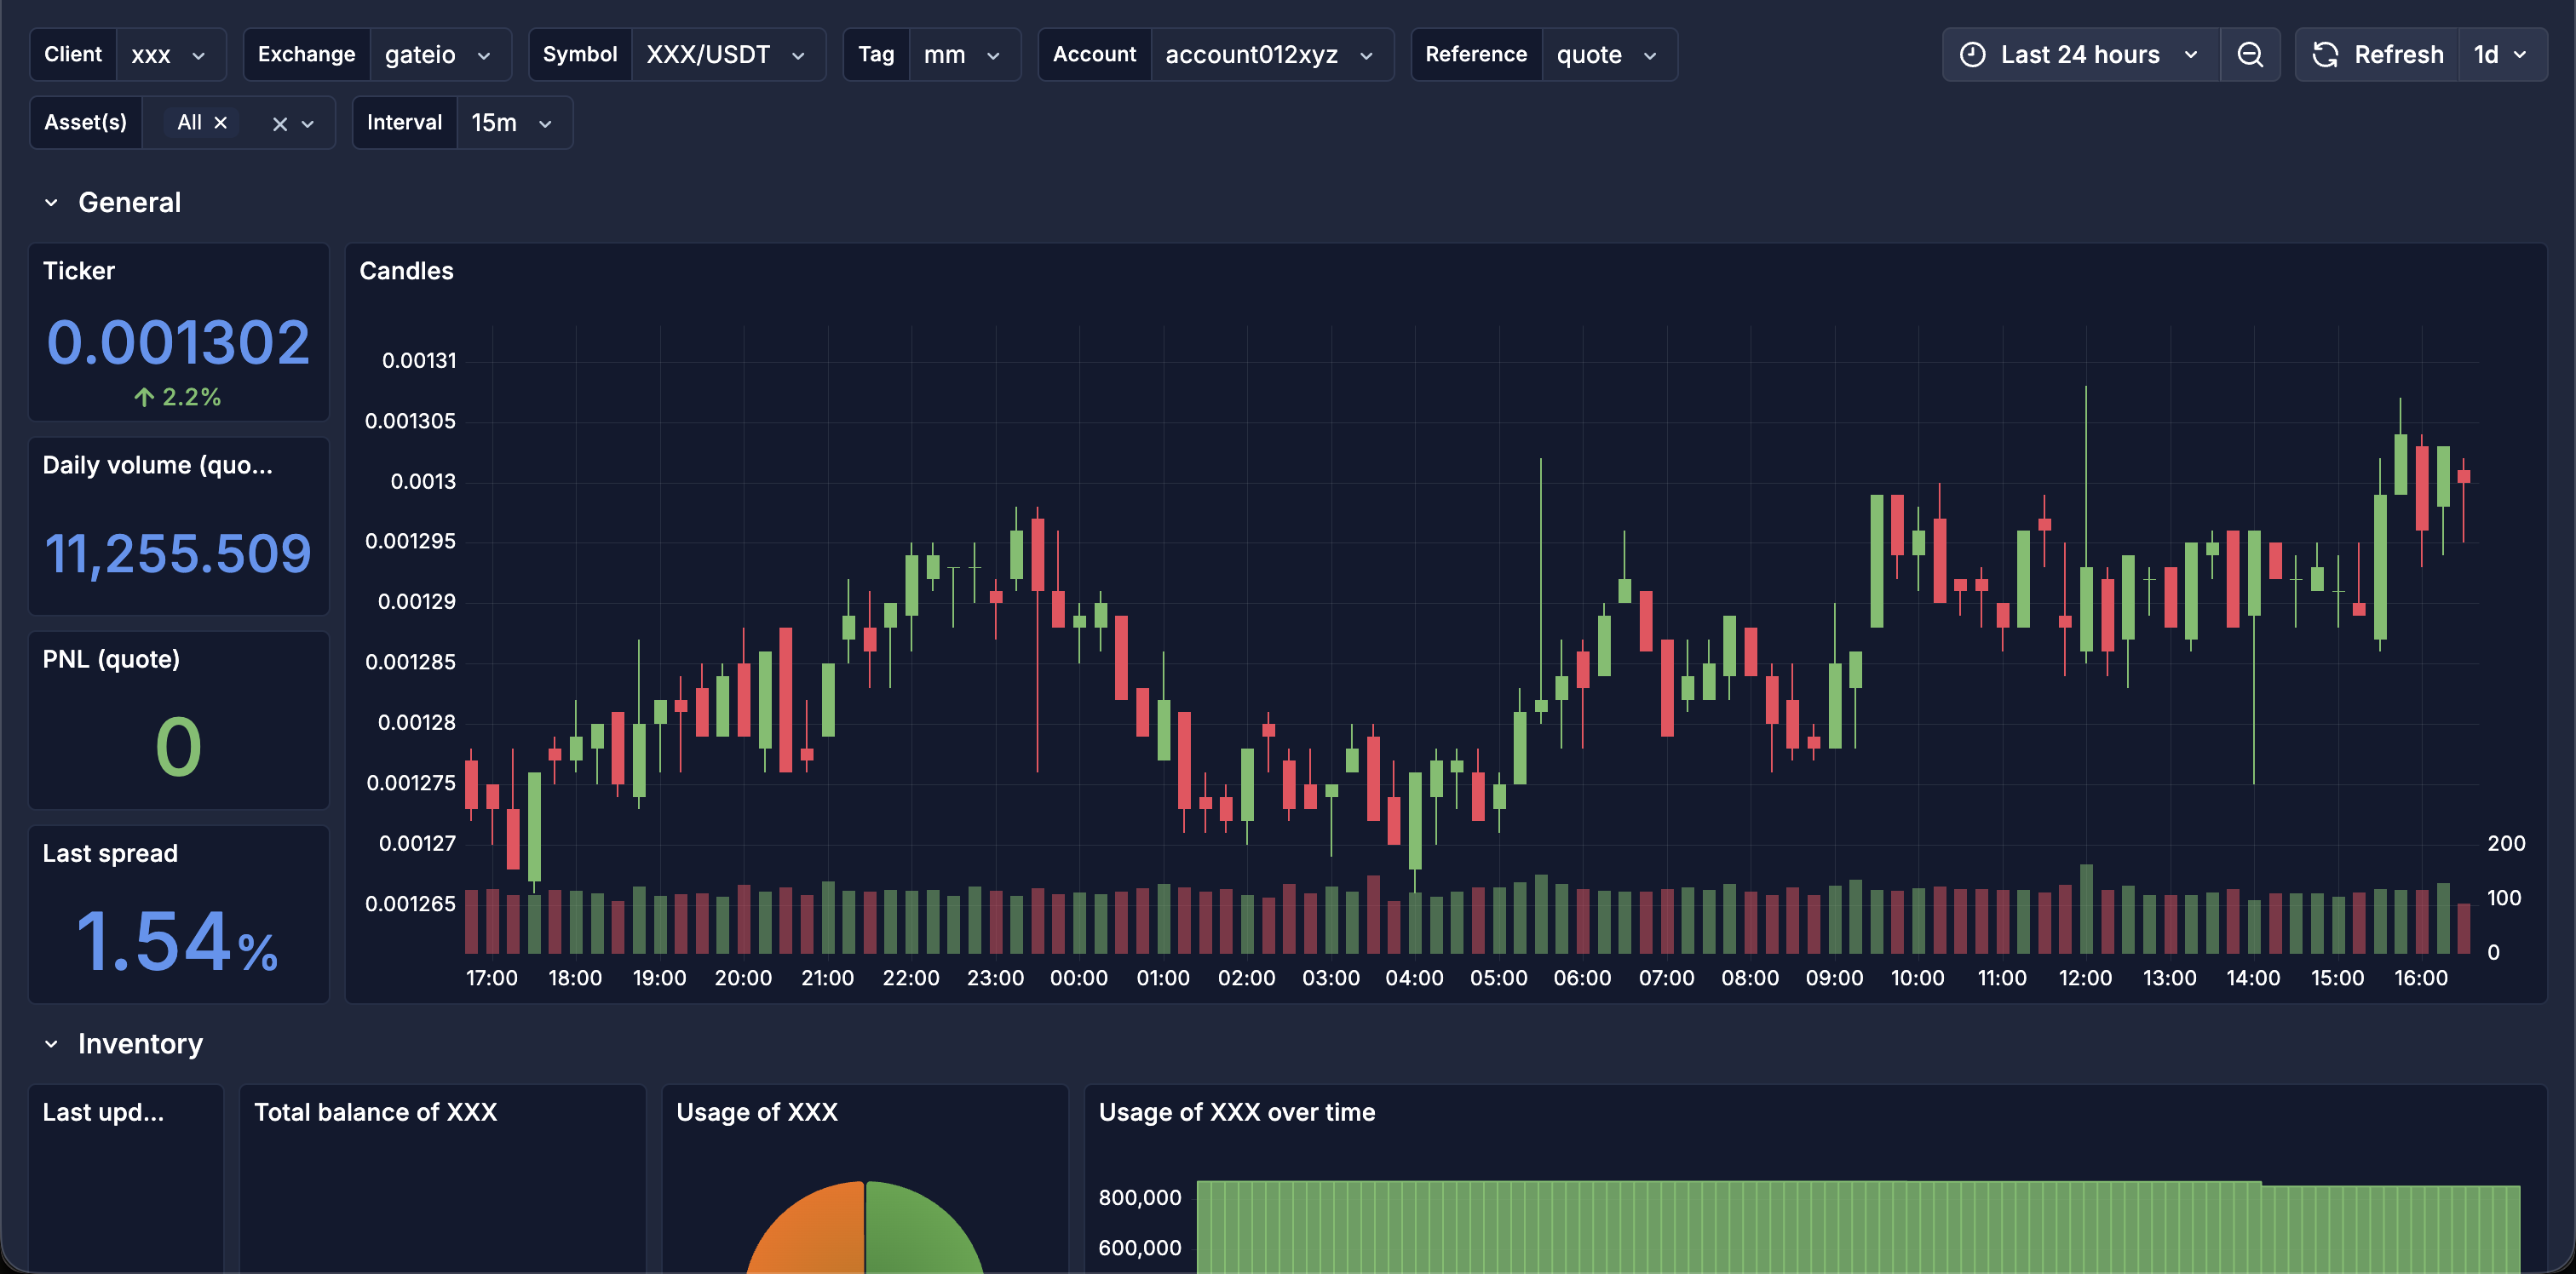
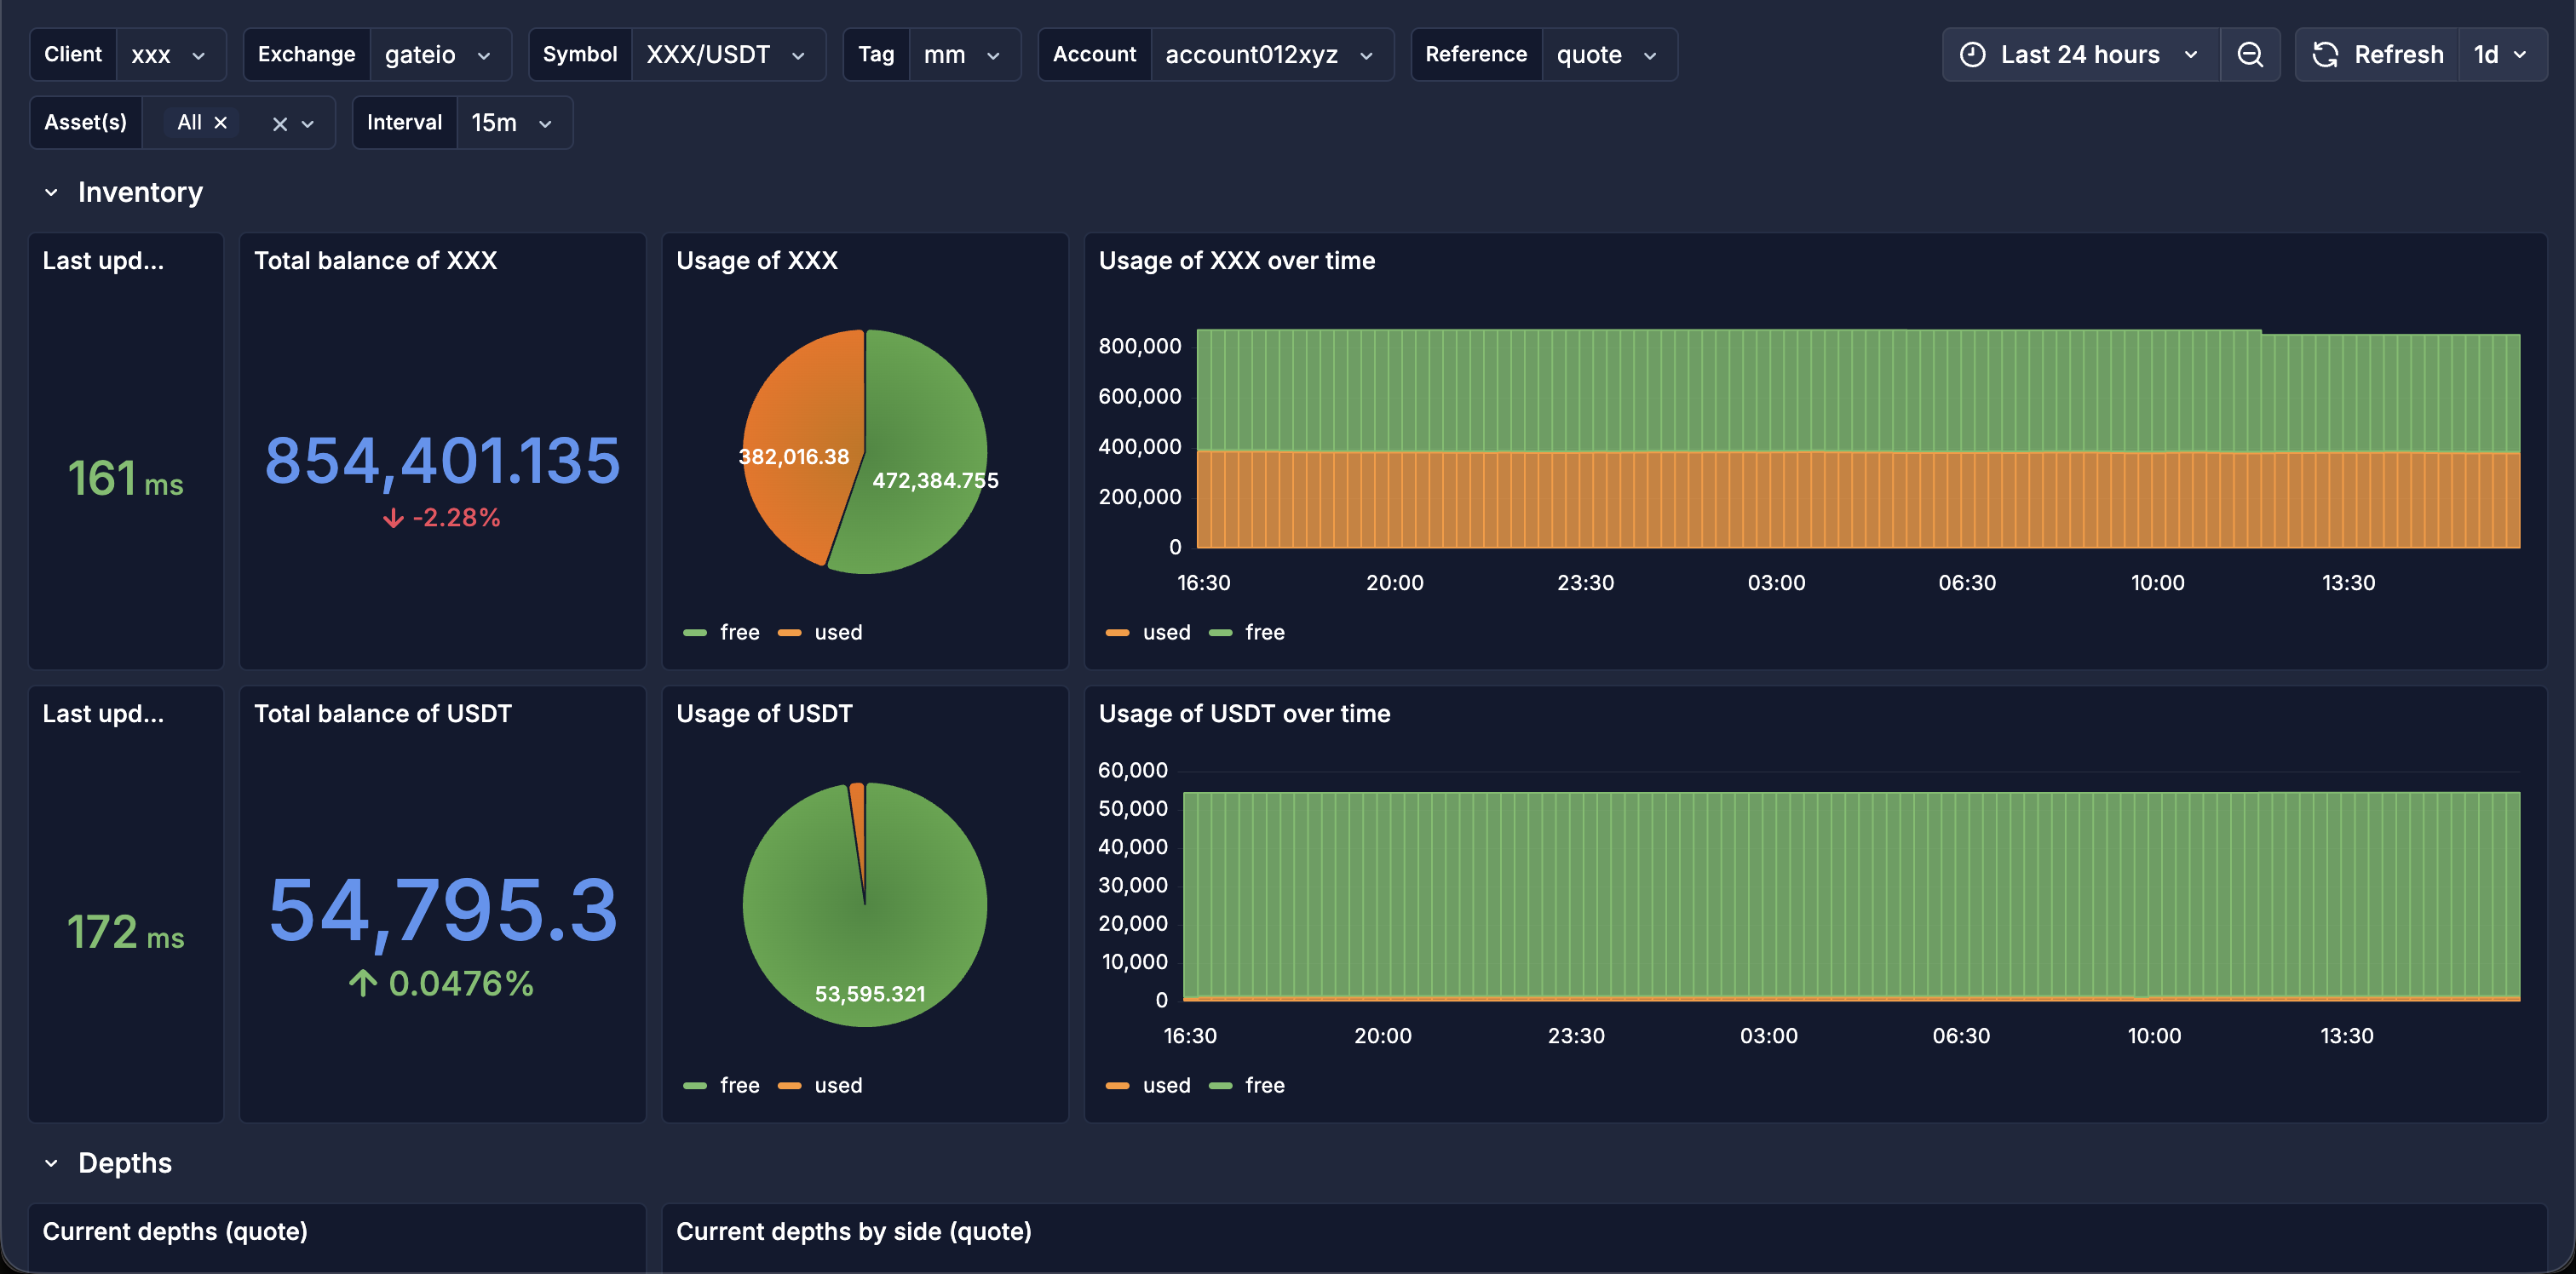
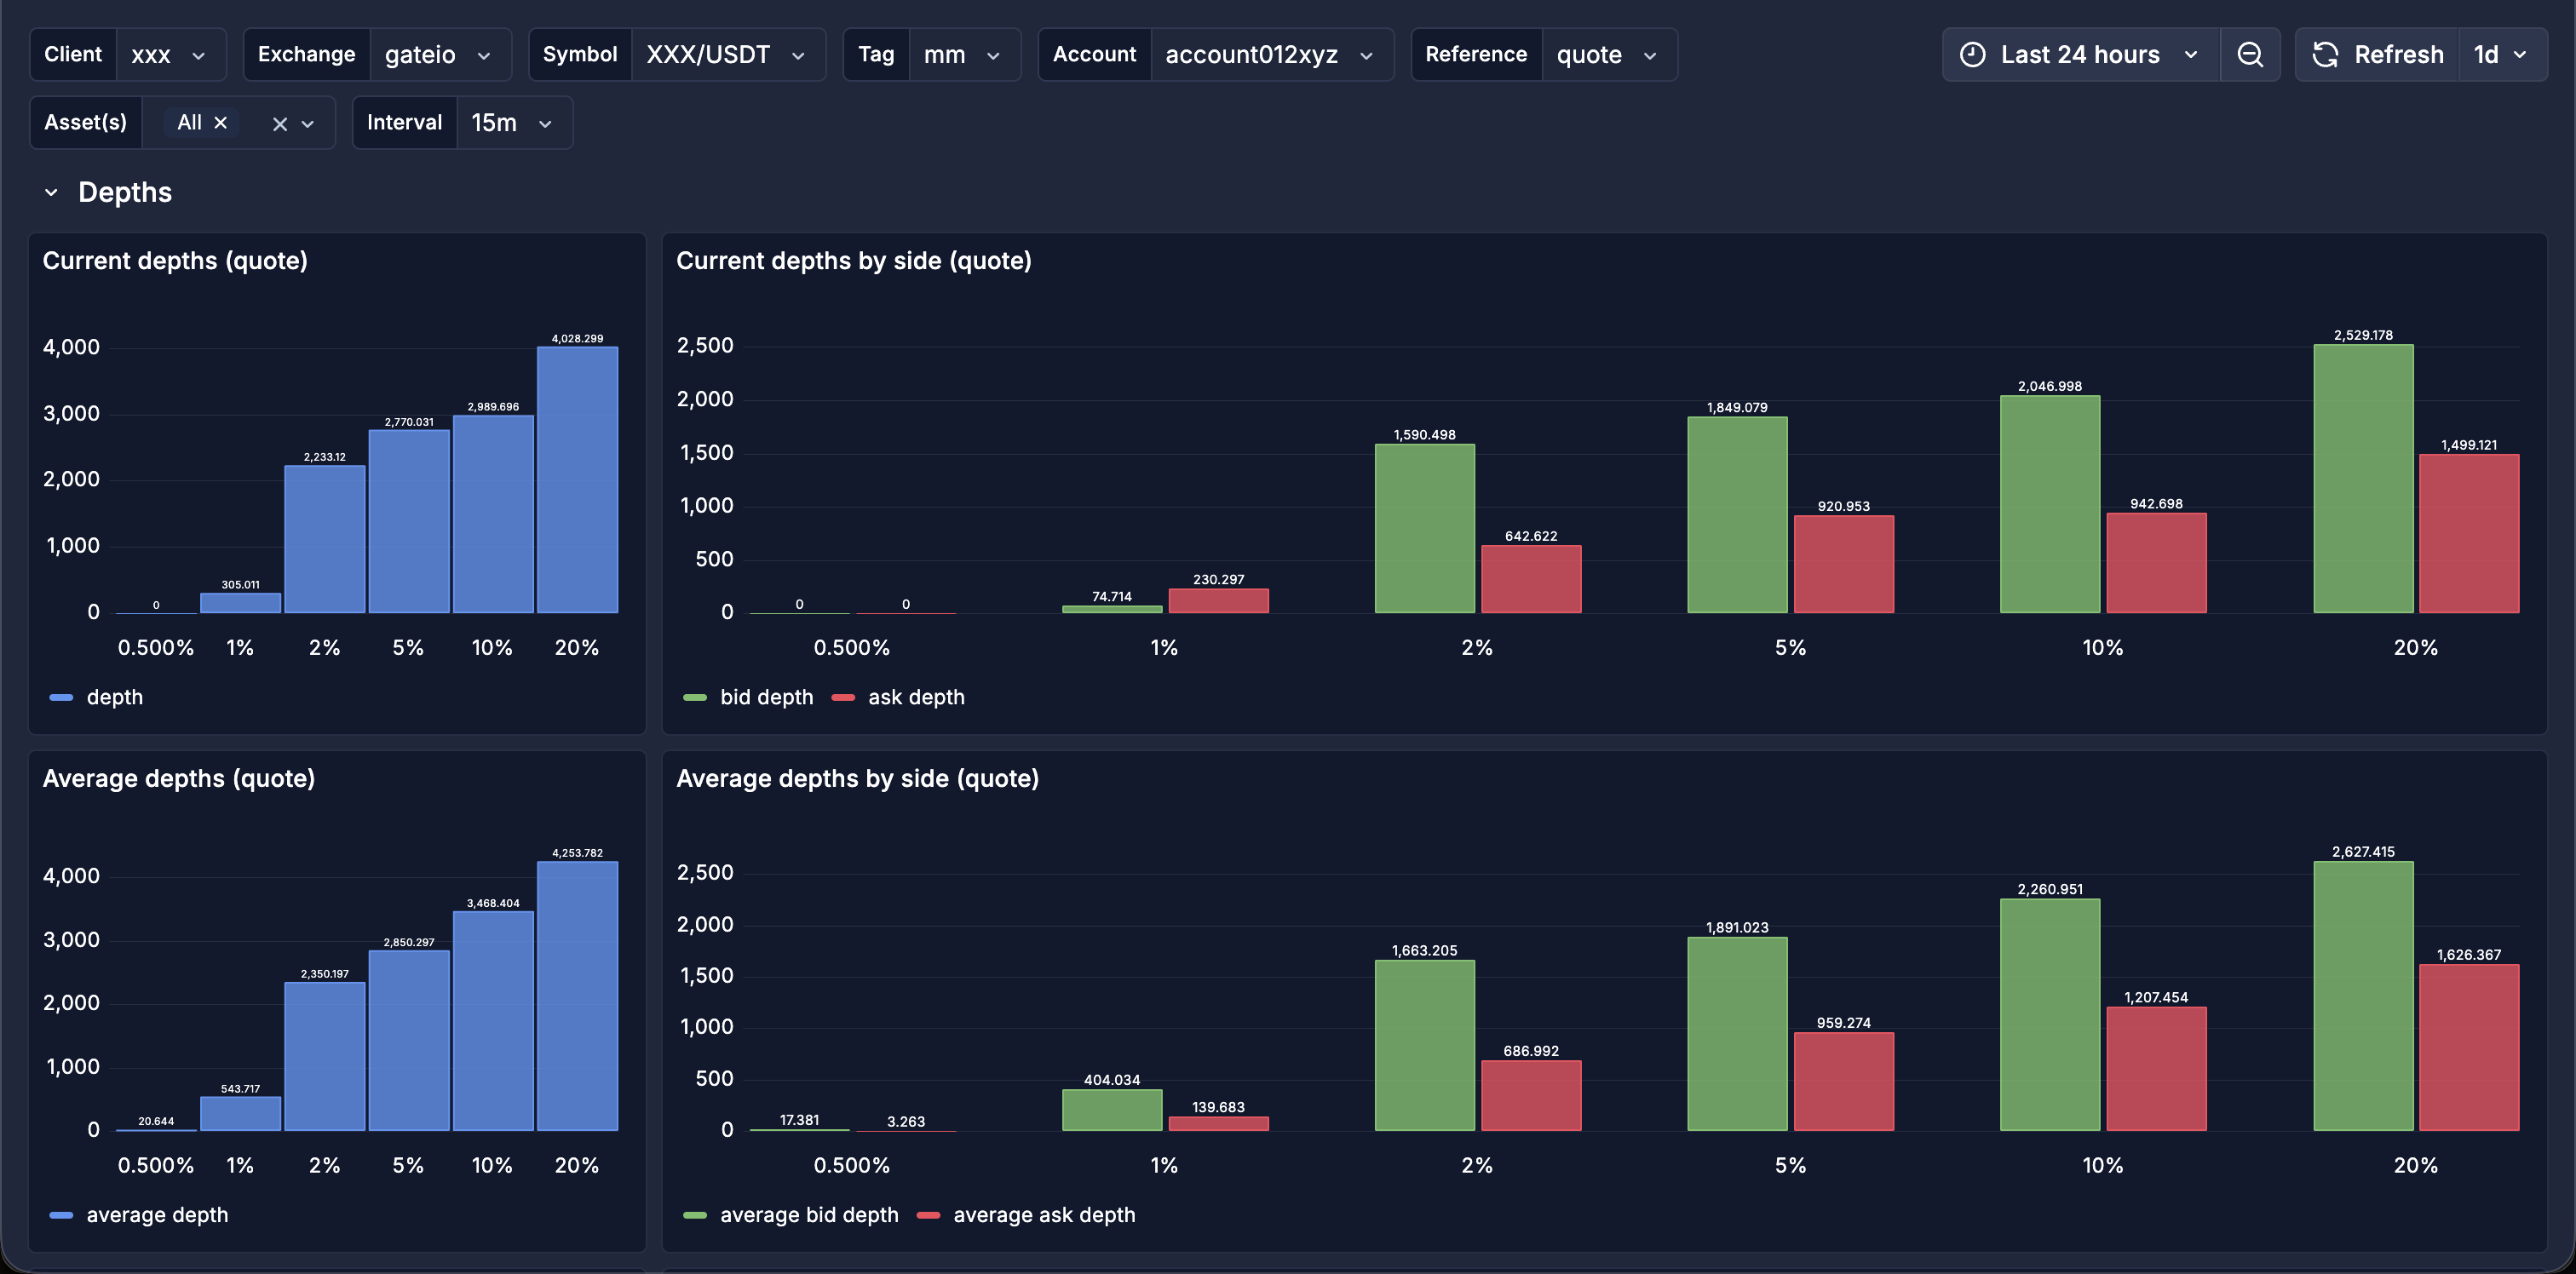
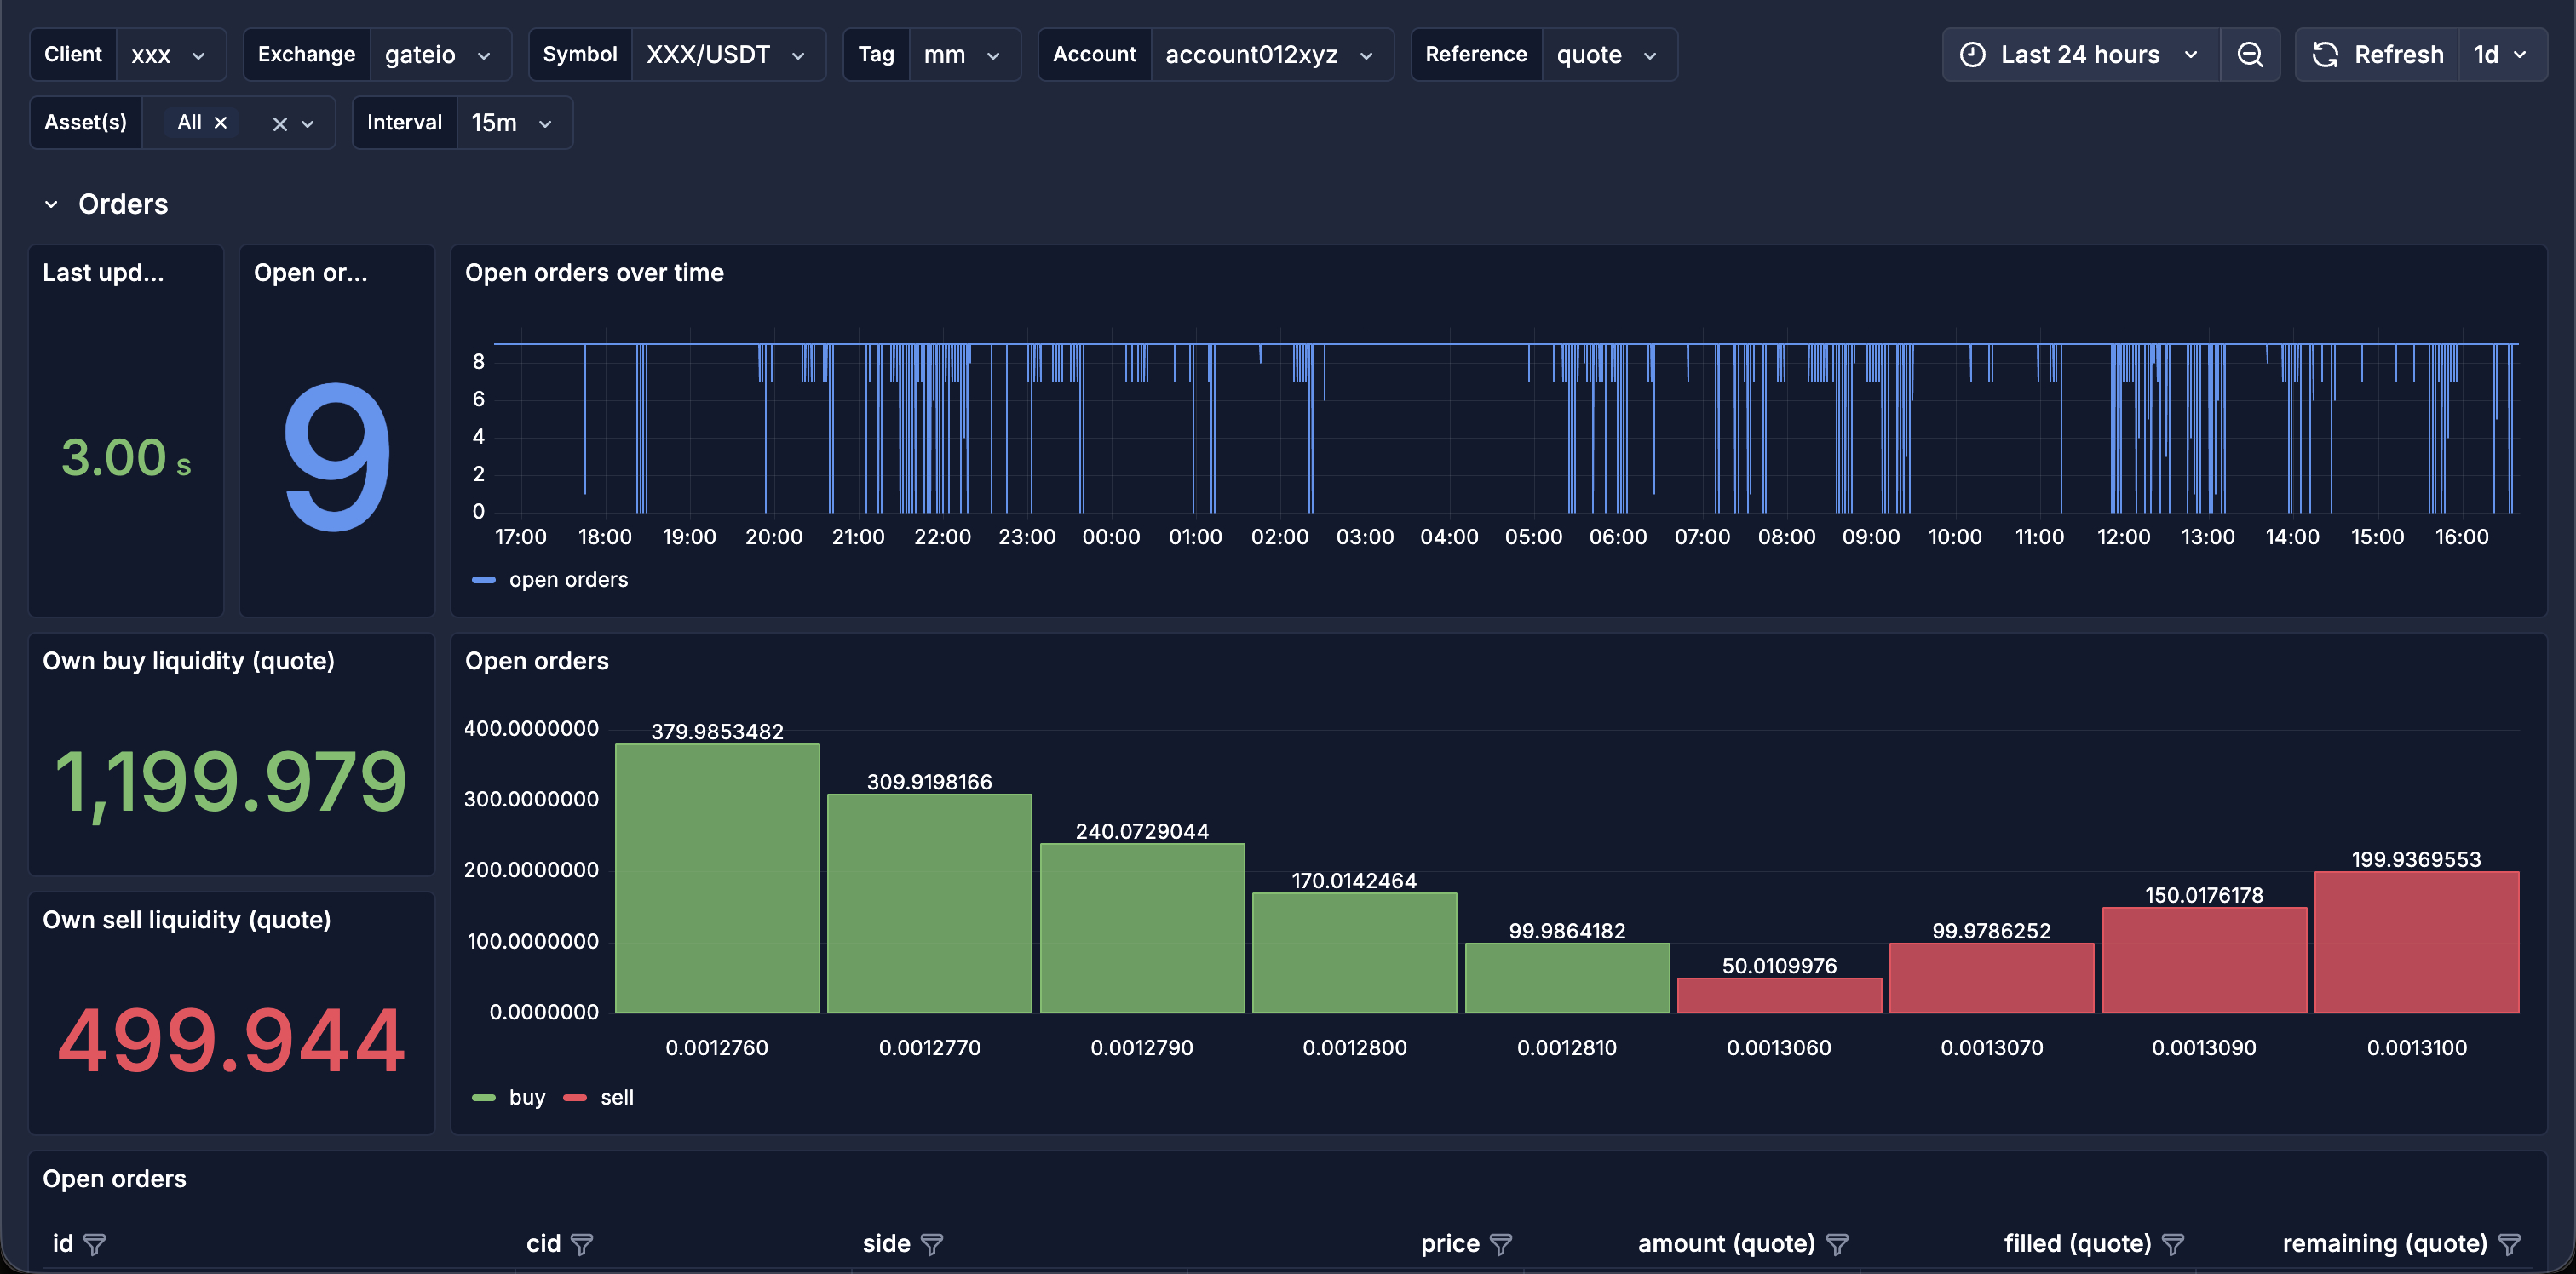
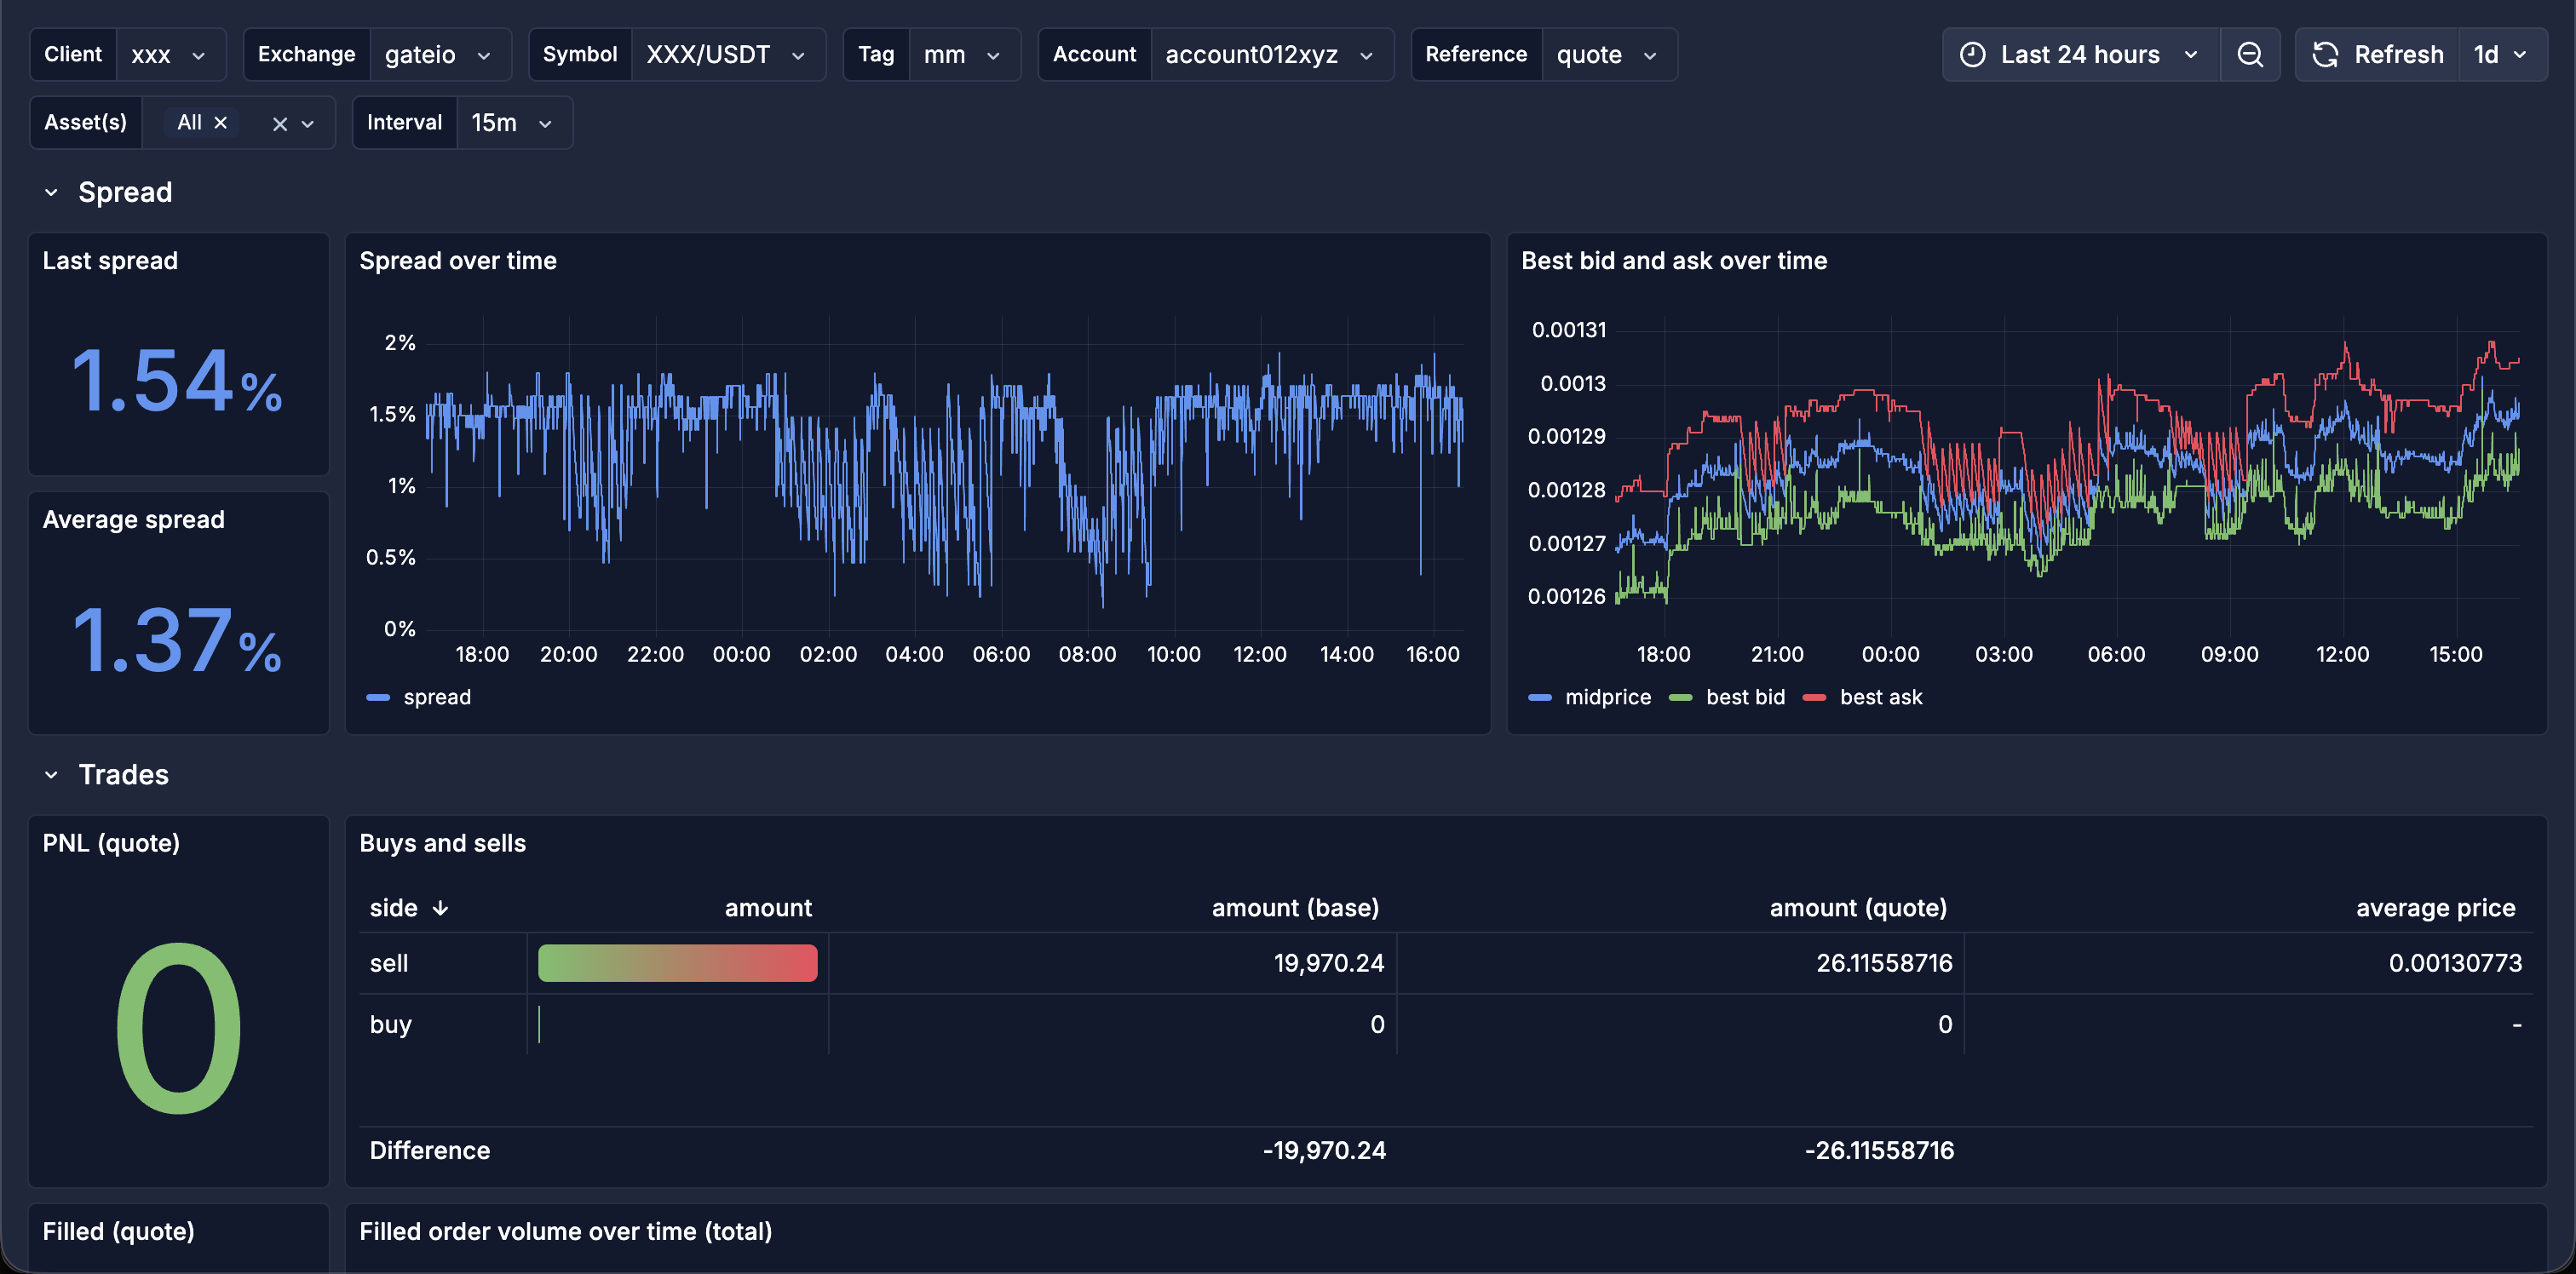
The dashboards are built as a single, fully templated Grafana board rather than one per client. Variables for client, exchange, symbol, account, tag, reference currency, asset and interval mean the same board covers every one of the thirty-plus mandates: pick a client and a venue, and every panel reflects it. It is organised into sections, each answering a market-making question:
- General: ticker, daily volume, PnL and last spread at a glance, with a candlestick chart.
- Inventory: balances and how each asset is being used, over time.
- Depths: our own order-book depth from 0.5% to 20% off mid, current and average, split by bid and ask side.
- Orders: open orders and their freshness, our buy and sell liquidity, and the live ladder we are posting.
- Spread: spread over time against target, plus best bid, best ask and mid price.
- Trades: buys versus sells, realized PnL and filled volume.
Alerting
Dashboards are for watching; alerts are for not having to. Alerts watch the signals that cost money if they drift, and page the desk in Slack and on-call, day or night:
- Data freshness: how old the last update is, so a stale feed or a stuck service is caught immediately.
- Spread out of band: the quoted spread leaving its target range.
- Inventory drift: balances moving away from where they should be.
- Silence: a service that stops reporting at all.
Results
- One templated dashboard gives real-time visibility across all thirty-plus clients and their venues.
- The desk sees spread, depth, inventory, orders and PnL at a glance, per client and per venue.
- Problems that used to be invisible (stale feeds, drifting spread, silent services) now page the team within seconds.
- The same metrics database feeds the AI copilot, so questions and reports draw on the same source of truth.
Key takeaways
For a 24/7 desk, observability is not a nice-to-have, it is part of the risk system. Sending structured metrics into a time-series database and driving both dashboards and alerts from it turned a fleet of services into something the team can actually watch and trust, and gave every other tool, including the AI copilot, a single source of truth to build on.